
Tapering…One Step at a Time – Part 2

Creating a Taper Plan
Review
In the previous post, I reviewed the benefits of tapering, and then I introduced the two first decisions you have to make about your taper plan:
The duration of the taper
The type of taper
I also described two common types: step and linear tapers. We are going to go into more detail now and run through the process of creating an actual plan.
Assumptions
For our purposes, we will look at creating an example of both a step and a linear taper plan. Here are the assumptions to keep in mind as we do this:
The athlete(s) do not have to travel to the competitive event, it is a “home” event.
The competition is on the last day of the taper.
Duration: both plans will be 14 days long.
Reduction in training volume (Step): 40%.
Reduction in training volume (Linear): 30%.
Average training volume per week: 5 sessions × 100 minutes/session = 500 minutes.
Intensity will be measured using the Rate of Perceived Exertion for each session (session – R.P.E.).
The average weekly volume and intensity of the previous phase is as follows: 500 minutes/week and a session – R.P.E. of 8.
We make no assumptions about the planning/periodization model being used. (More on this in a future post!)
Because we are using session – R.P.E. to track intensity, the formula to calculate athletes' training load is as follows (Haddad et al., 2017):
Training Load (A.U.) = Volume (minutes) × Intensity (session – R.P.E.)
Note: A.U. stands for “arbitrary units.” The units are arbitrary because we are performing this calculation to compare the training load in the past with that in the future.
Given our assumption #8, this means that we can calculate the average training load for the previous phase of the plan as follows:
Training load of the previous phase (A.U.) = 500 minutes × 8 R.P.E. = 4000 A.U.
Creating the Plans
Example of a Step Taper
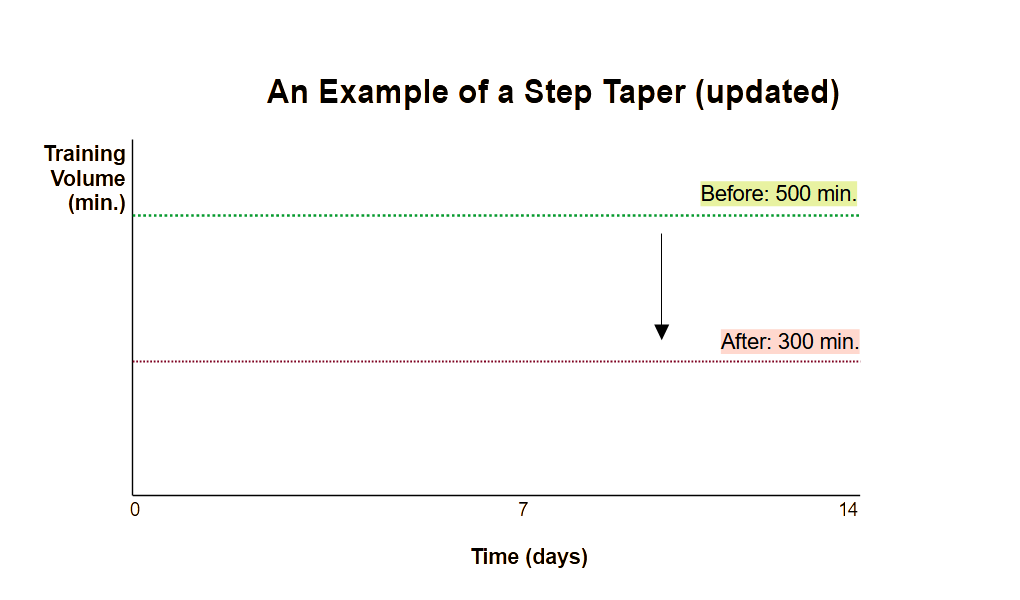
I am going to keep the example of the step taper very simple, and we are going to drop the training volume only once. Remember, we're assuming that training volume drops by 40% (assumption #4), which means it will go from 500 minutes to 300 minutes. In addition, intensity will vary from session to session, and the average for the entire taper will be 9 (session – R.P.E.).
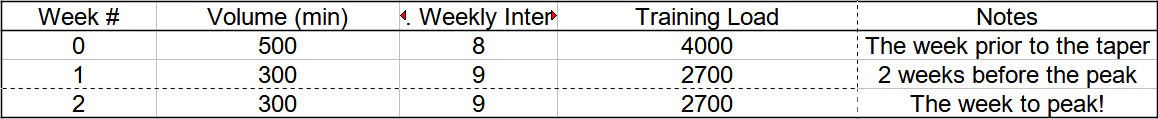
And here is what this step taper plan looks like followed by a simple weekly breakdown. This is also known as a one-step taper, because there is only one drop in volume during that period of time:
Here are some suggestions for how to reduce the training volume from 500 to 300 minutes:
Cancel 2 practices each week.
Reduce the scheduled practice time for some or all of the sessions.
Schedule other preparatory work during a practice if the duration of that session is being reduced.
Example of a Linear Taper
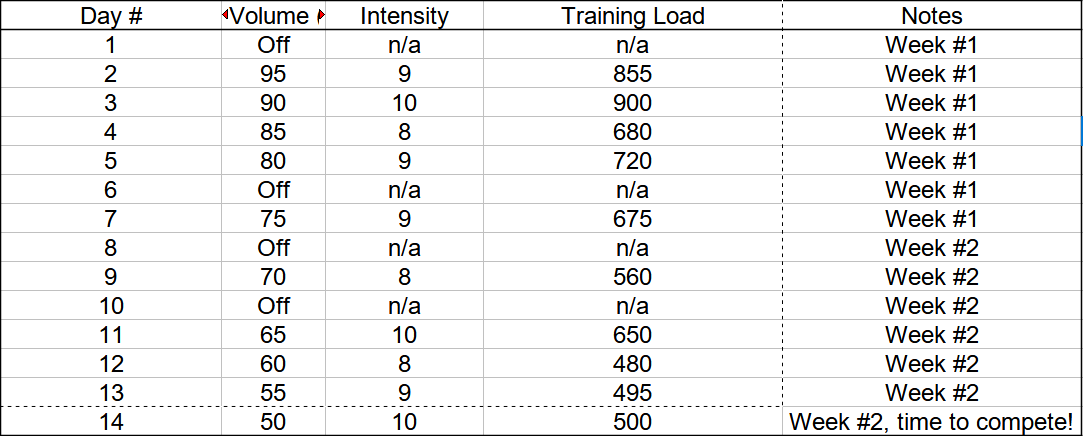
For this example, we will keep the same target R.P.E. of 9. We will also reduce training volume by 5% of the maximum in each training session. Since the maximum training volume per session is 100 minutes, or 1hour and 40 minutes (assumption #6), the reduction in volume plays out daily as follows:
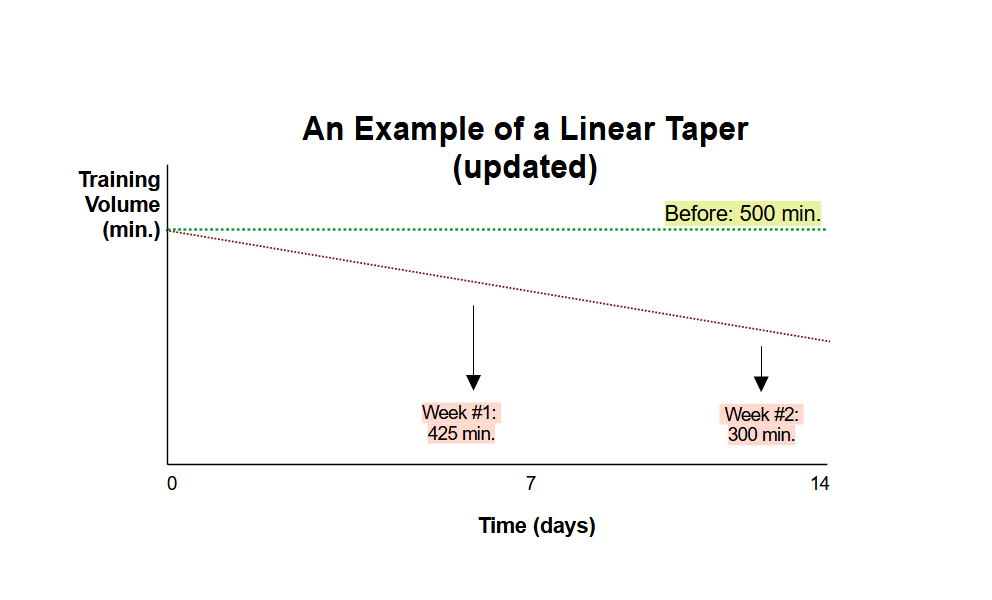
Okay, so we have lots of information on the day-to-day level. The diagram and table below shows you what happens when we condense this information into a weekly summary the way we did for the Step Taper:
Quick Analysis
While these two examples took athletes on different paths, the volume, intensity, and training load were identical in week #2 for both tapers. Does that mean anything? No. But it is an nice way of showing you that the weekly summaries don't tell the whole story!
Now, if we compare each of these taper plans with the training load of the previous phase (500 minutes × 8 session – R.P.E. = 4000 AU):
In the Step Taper, we easily met our goal of reducing the training volume to 300 minutes (40% less).
The Step Taper reduced the average weekly training load by 32.5% to 2700 AU.
In the Linear Taper, we didn't quite meet our goal of reducing training volume by 30%, to 700 minutes for the entire taper. Instead, the total training volume for week #1 and week #2 is 725 minutes, or a 27.5% reduction.
When we compare the week before the taper and week #1 of the Linear Taper, we see that the weekly training load dropped by approximately 4.4%. in week #1.
When we compare the week before the taper and week #2 of the Linear Taper, we see that the weekly training load dropped by approximately 32.5%.
Until the Next Time
We just went through two examples of how to build both a step and linear taper. Based on the experience of your athletes, you could of course make different choices. That being said, the principles do not change.
In the next post, I'll dig into what we know about the effectiveness of tapering.
Thank you for taking the time to read this article. I hope you found it useful. Subscribe to this newsletter to automatically receive free content:
References
Haddad, M., Stylianides, G. A., Georgios Stylianides, Djaoui, L., Dellal, A., Chamari, K., Karim Chamari, & Chamari, K. (2017). Session-RPE Method for Training Load Monitoring: Validity, Ecological Usefulness, and Influencing Factors. Frontiers in Neuroscience, 11, 612–612. https://doi.org/10.3389/fnins.2017.00612